The Panel intends to update this section of the website on an annual basis. This page was last updated on 7 March 2025.
Between 11 March 2000 and 31 December 2024, the Panel received 689 applications. The following chart shows the number of Panel applications received by calendar year from 2000 to 2024.
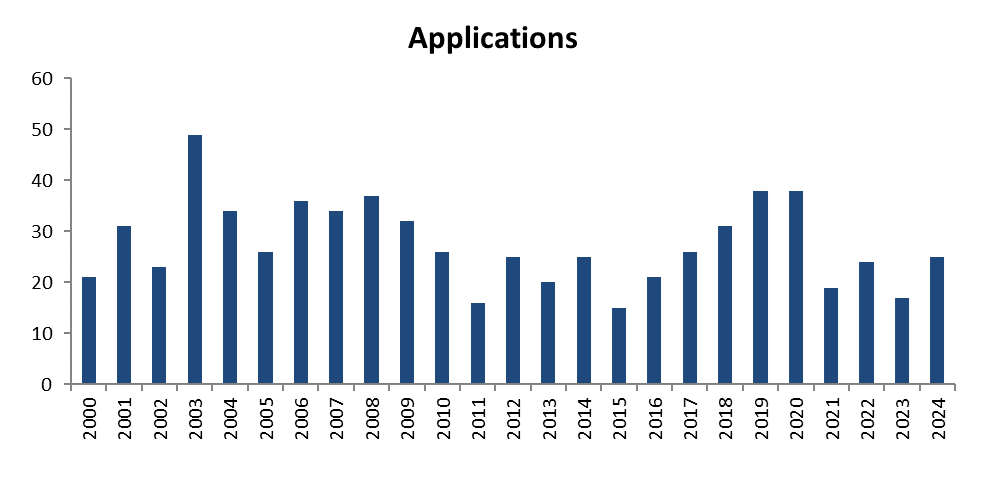
Text description: Applications chart
Bar chart shows the number of Panel applications received by calendar year from 2000 to 2024.
| Year | Applications |
|---|---|
| 2000 | 21 |
| 2001 | 31 |
| 2002 | 23 |
| 2003 | 49 |
| 2004 | 34 |
| 2005 | 26 |
| 2006 | 36 |
| 2007 | 34 |
| 2008 | 37 |
| 2009 | 32 |
| 2010 | 26 |
| 2011 | 16 |
| 2012 | 25 |
| 2013 | 20 |
| 2014 | 25 |
| 2015 | 15 |
| 2016 | 21 |
| 2017 | 26 |
| 2018 | 31 |
| 2019 | 38 |
| 2020 | 38 |
| 2021 | 19 |
| 2022 | 24 |
| 2023 | 17 |
| 2024 | 25 |
On average, it takes a little over 2 weeks (17.7 days) for the Panel to make a decision on an application. The following chart shows the average number of days from application to decision for each calendar year from 2000 to 2024.
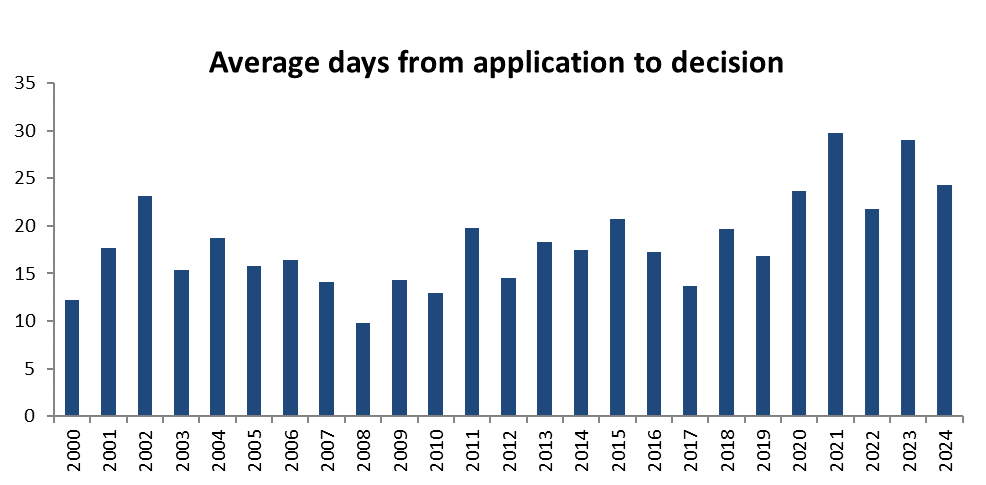
Text description: Average days from application to decision chart
Bar chart shows the average number of days from application to decision, from 2000 to 2024.
| Year | Average of days to decision |
|---|---|
| 2000 | 12.2 |
| 2001 | 17.7 |
| 2002 | 23.1 |
| 2003 | 15.3 |
| 2004 | 18.7 |
| 2005 | 15.7 |
| 2006 | 16.4 |
| 2007 | 14.1 |
| 2008 | 9.8 |
| 2009 | 14.3 |
| 2010 | 13.0 |
| 2011 | 19.8 |
| 2012 | 14.6 |
| 2013 | 18.3 |
| 2014 | 17.4 |
| 2015 | 20.7 |
| 2016 | 17.3 |
| 2017 | 13.7 |
| 2018 | 19.6 |
| 2019 | 16.9 |
| 2020 | 23.6 |
| 2021 | 29.7 |
| 2022 | 21.8 |
| 2023 | 29.1 |
| 2024 | 24.3 |
On average, it takes a little over a month (34.9 days) for the Panel to publish reasons after the decision is made. The following chart shows the average number of days from decision to publication of reasons for each calendar year from 2000 to 2024.
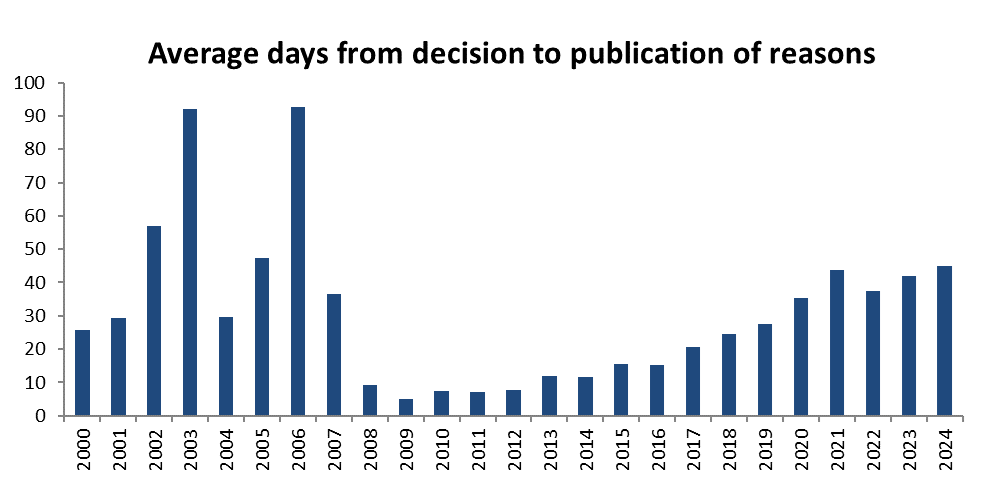
Text description: Average days from decision to publication of reasons chart
Bar chart shows the average days from decision to publication of reasons, from 2000 to 2024.
| Year | Average of days for reasons |
| 2000 | 25.6 |
| 2001 | 29.4 |
| 2002 | 57.0 |
| 2003 | 92.1 |
| 2004 | 29.8 |
| 2005 | 47.2 |
| 2006 | 92.8 |
| 2007 | 36.7 |
| 2008 | 9.2 |
| 2009 | 5.0 |
| 2010 | 7.3 |
| 2011 | 7.0 |
| 2012 | 7.8 |
| 2013 | 11.8 |
| 2014 | 11.5 |
| 2015 | 15.5 |
| 2016 | 15.2 |
| 2017 | 20.7 |
| 2018 | 24.5 |
| 2019 | 27.4 |
| 2020 | 35.4 |
| 2021 | 43.9 |
| 2022 | 37.6 |
| 2023 | 41.9 |
| 2024 | 45.0 |